

Physical Therapy Statistics (Top Picks)
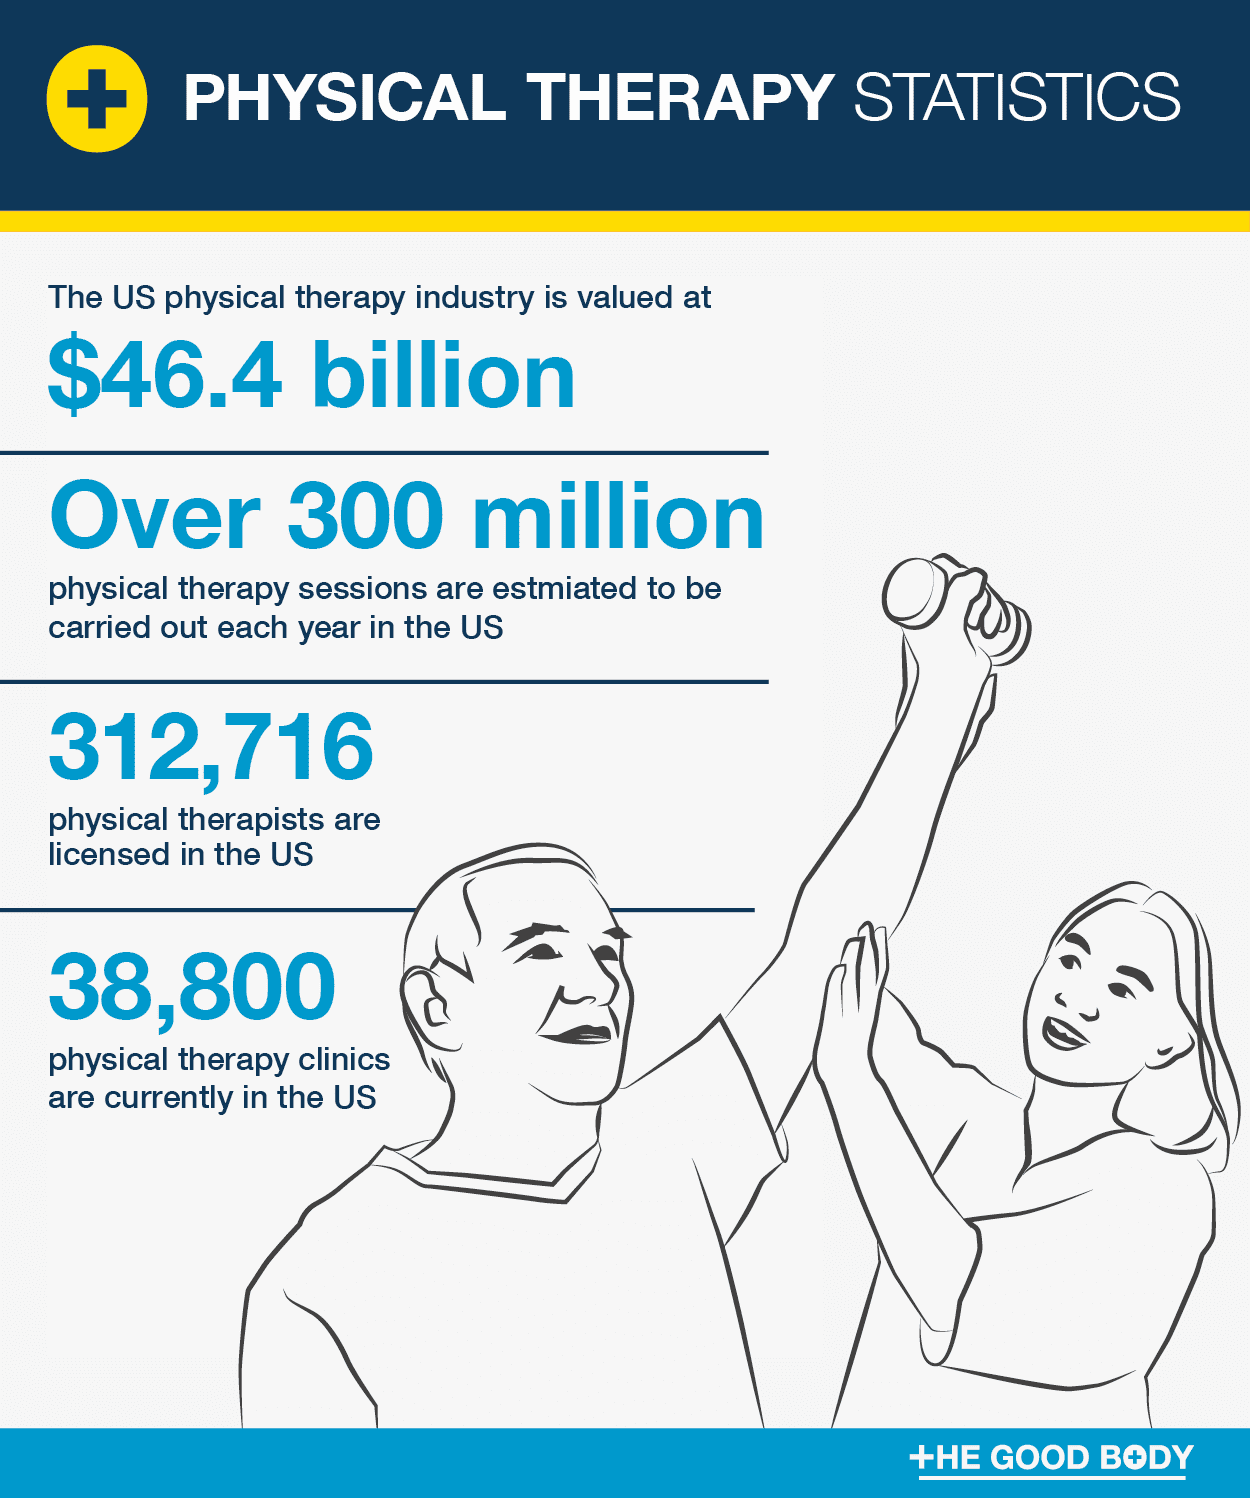
- As of 2019, there are 312,716 licensed physical therapists in the US.
- Between 101 and 200 patients are seen in the average physical therapy clinic each week.
- There are currently 38,800 physical therapy clinics in the US.
- A physical therapy patient is most likely to be female and over the age of 65.
- The US physical therapy industry is valued at $46.4 billion.
- Globally, there are 1,600,606 registered physical therapists.
- The salary of the average physical therapist is $95,620.
2022 Physical Therapy Statistics & Facts
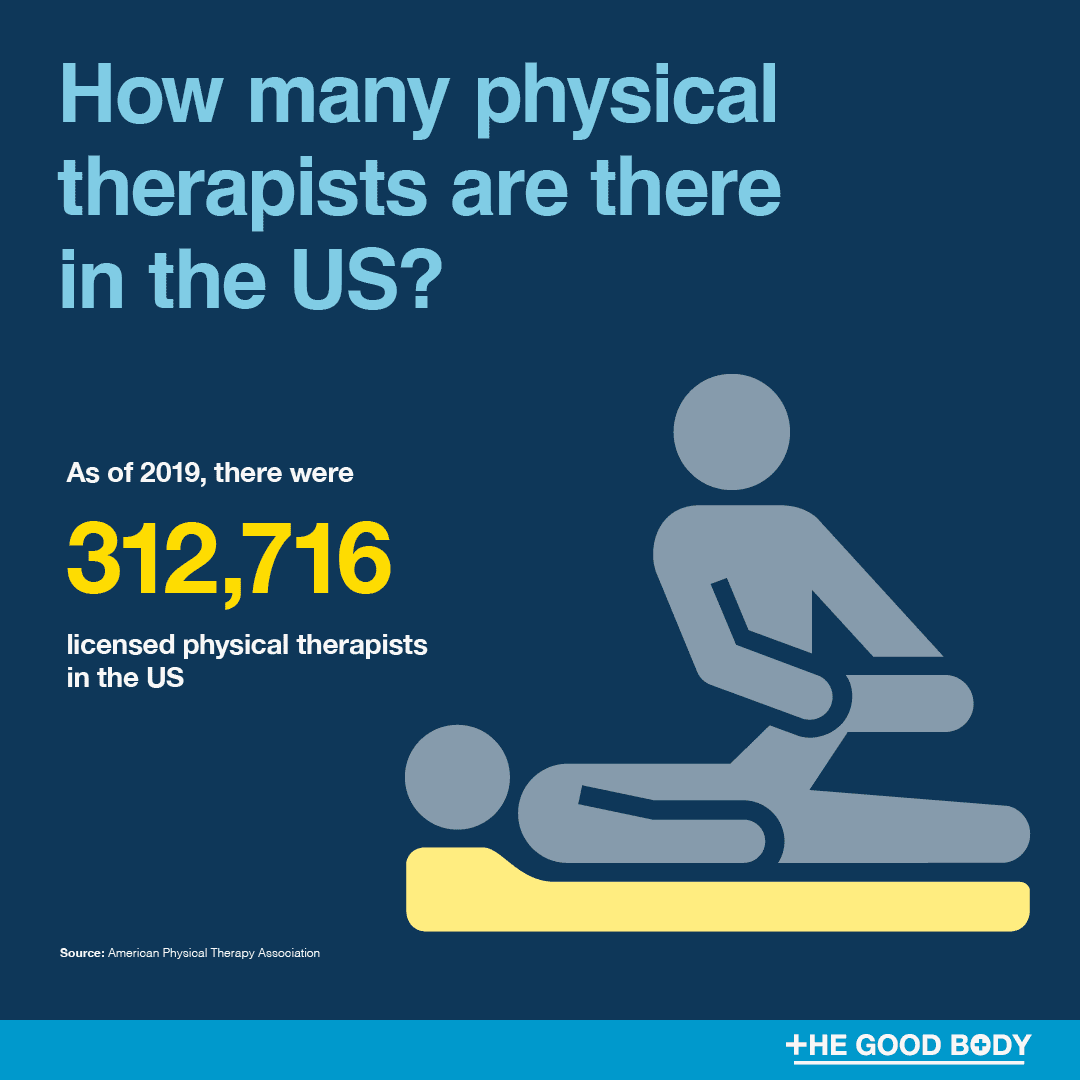
How many physical therapists are there in the US?
According to the American Physical Therapy Association, as of 2019, there are 312,716 licensed physical therapists in the US.
The average physical therapy clinic sees between 101 and 200 patients each week.
Do you live in California, New York or Texas? You’re spoiled for choice, as these states have more physical therapists than any other!
How many physiotherapy clinics are there in the US?
38,800 physical therapy clinics currently operate in the US.
If we assume that each one sees an average of 150 patients each week, that equates to over 300 million therapy sessions each year!
Where are most physical therapists located?
According to the latest data from the U.S. Bureau of Labor Statistics, most physical therapists are located in private physical therapy clinics, followed by hospitals and home health care services.
The industries that employ the most physical therapists are broken down as follows:
- 36% Private Outpatient Clinics/Offies
- 29% Hospitals (State, Local and Private)
- 11% Home Health Care Services
- 5% Nursing and Residential Care Facilities
- 3% Self-Employed Workers (Independent)
What age group are most physical therapists patients?
Data published by the American Physical Therapy Association revealed that most physical therapy patients are aged over 65.
Below is a breakdown by age group:
- 36.1% over 65 years old
- 25% between 20 and 64 years old
- 26.7% between 18 and 49 years old
- 6.6% between 11 and 17 years old
- 4.1% between 2 and 10 years old
- 1.5% under 2 years old
Clients of physical therapists are also more likely to be female (55%).
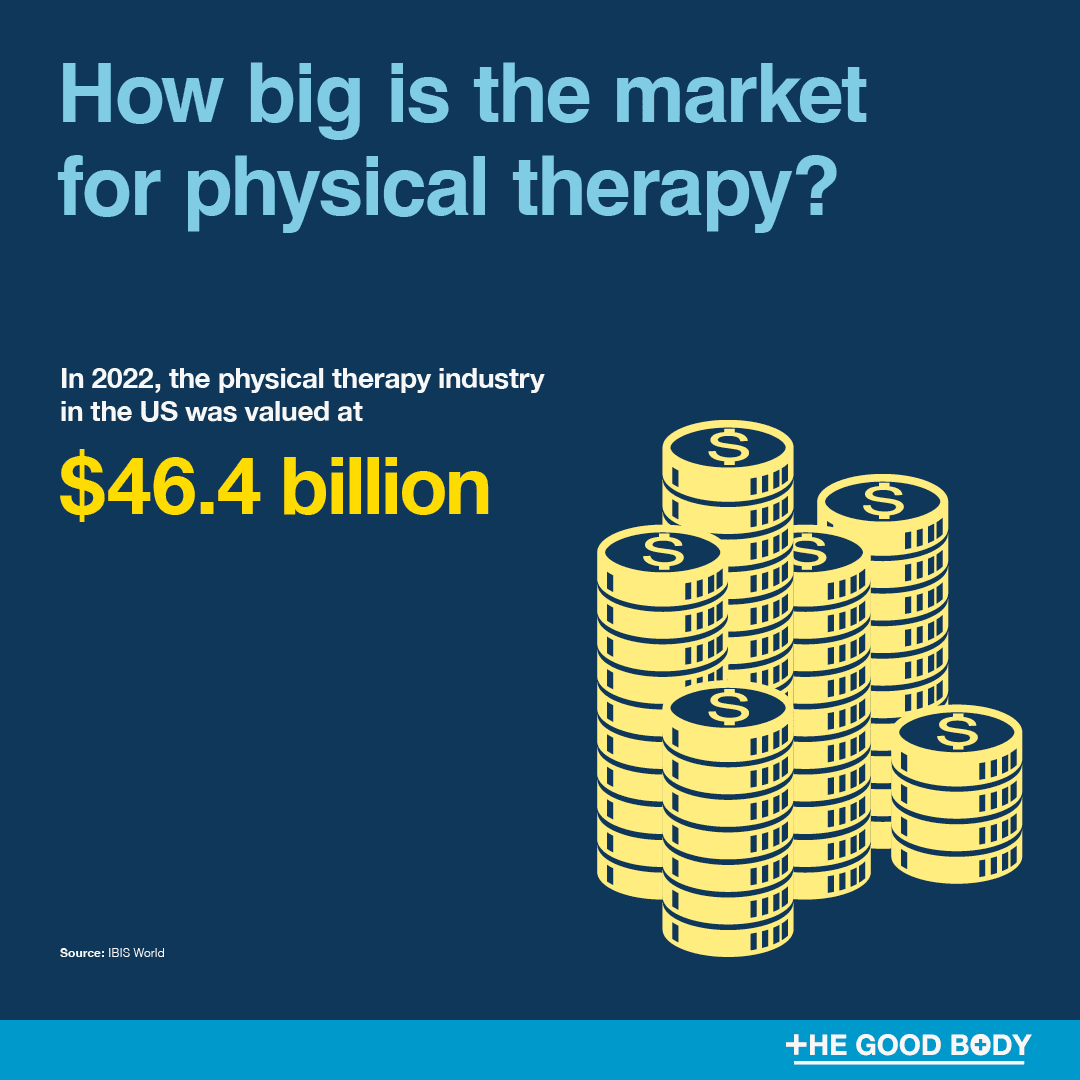
How big is the market for physical therapy?
In 2022, the physical therapy industry in the US was valued at $46.4 billion.
Analysts report that though the industry has grown at an average annual rate of 3.4% over the last five years, it has been impacted significantly by the COVID-19 pandemic.
Why do people go through physical therapy?
There are many reasons a person might go through physical therapy, including for pain management, mobility improvements and surgery avoidance.
Research published by Professional Therapy Associates revealed that 46% of patients are undergoing physical therapy to get relief from some form of spine pain.
Physical therapists can use complementary therapies to help with back pain, such as hypnosis and powerful, highly-rated TENS units.
Back pain is a huge issue in the US. In fact, back pain statistics show that 80% of Americans will experience back pain at some point in their lives.
What conditions are treated with physical therapy?
A wide range of conditions are treated with physical therapy, including a host of different pain conditions such as chronic back pain and osteoarthritis.
In fact, research published by the Palmer College of Chiropractic revealed that 41% of patients looking for a drug-free pain relief option, found physical therapy to be the most effective alternative treatment.
Overall, 78% of those surveyed said they preferred drug-free approaches compared to pain medication.
68% also described physical therapy as very safe, much safer (in their opinion) than pain-relief drugs (23%). Chiropractic care was another therapy highly rated in the survey, with its own benefits highlighted in recent chiropractic statistics.
Do you need a referral to see a physical therapist in the US?
You do not need a referral to see a physical therapist in the US.
Some states do have restrictions about exactly what services a physical therapist can provide without a referral. You can check the restrictions in your state on the American Physical Therapy Association website.
If you thought you needed a referral you’re not alone! 70% of patients think they need a referral to see a physical therapist, however a referral is not required.
What’s the average number of physical therapy visits?
On average, patients see a physical therapist for between six and 12 sessions.
However Mary Ann Wilmarth, DPT, Chief of Physical Therapy at Harvard University Health Services, says “just one or two sessions “can get people going in the right way”.
How many physical therapists are there in the world?
There are 1,600,606 physical therapists practicing worldwide.
It’s no surprise that the number is so high, when you consider that chronic pain statistics show at least 10% of the world’s population is living with chronic pain.
2022 Physical Therapy Key Statistics:
- As of 2019, there are 312,716 licensed physical therapists in the US.
- An average physical therapy clinic sees up to 200 patients each week.
- California, New York and Texas are the states with the most physical therapists.
- 38,800 physical therapy clinics currently operate in the US.
- 36.1% of physical therapy patients are over 65.
- 55% of physical therapy patients are female.
- The value of the US physical therapy industry is estimated to be $46.4 billion.
- 46% of patients undergoing physical therapy are looking for relief from spine pain.
- 68% of patients describe physical therapy as very safe.
- An average patient sees a physical therapist for between six and 12 sessions.
- There are 1,600,606 physical therapists practicing worldwide.
Sources: American Physical Therapy Association | Rehab U Practice Solutions | U.S. Bureau of Labor Statistics | MarketResearch.com | American Physical Therapy Association | IBIS World | Guthrie | JoTo PR | Choose PT | Mercedes Medical Centers | World Confederation for Physical Therapy
Physical Therapy Employment Statistics & Facts
How many physical therapists are female?
68% of physical therapists are female.
Interestingly, research published in the Physical Therapy & Rehabilitation Journal found that despite it being a female-dominated industry, male physical therapists had higher aspirations.
919 physical therapy students were surveyed for the study. Men were much more likely than female students to expect to own their own practice, become a manager or have a higher income in the first year of employment.
It’s worth mentioning, that physical therapy actually started life as a female only profession!
The first professional association was formed in 1921 and was known as the ‘American Women’s Physical Therapeutic Association’. It included just 274 female physical therapists.
How much do most physical therapists make?
The latest physical therapist statistics show that the average physical therapist earns $95,620.
Though different sources report slightly different figures, all seem to agree on the fact that male physical therapists earn more than their female counterparts.
It’s certainly a growing profession, with the employment of physical therapists expected to grow 17% by 2031.
This is much faster than many other professions. There are a number of reasons for this growth, including aging baby boomers and the increase in mobility issues stemming from health problems such as diabetes and obesity.

What is the average age of a physical therapist?
The average age of a physical therapist is 41.
It’s also thought to be a rewarding profession — physical therapy was actually once named one of the Top 10 Happiest Jobs!
A number of reasons were given, including the social nature of the role, positive outcomes for patients and healthy rates of pay.
Physical Therapy Employment Key Statistics:
- 68% of physical therapists are female.
- The salary of the average physical therapist is $95,620.
- The physical therapy profession is expected to grow 17% by 2031.
- The average age of a physical therapist is 41.
Sources: Data USA | Oxford Academic | American Physical Therapy Association | U.S. Bureau of Labor Statistics | Forbes
Understanding the root cause…
Now you have all the information about the physical therapy industry, you might be wondering why it’s thriving?
Read our back injury statistics article and you’ll soon learn why!


